How To Set Up Google Analytics GA4

Nick Czerwinski
PPC & Local SEO Specialist
If you own a website, whether it’s for personal or business use, you want to know how it’s performing. Are people visiting your website? How long are they staying on your site? What pages are they viewing? These are all critical questions to answer if you want to improve your website’s performance and provide a better user experience for your visitors.
That’s where Google Analytics comes in. Google Analytics is a free web analytics service offered by Google that allows website owners to track and analyze their website’s performance. Using Google Analytics, you can get valuable insights into how people interact with your website, what content is widespread, and what needs improvement.
In this blog post, we’ll provide a step-by-step guide on how to set up Google Analytics 4 on your website. We’ll cover everything from signing up for an account to viewing and interpreting your data. By the end of this guide, you’ll better understand how to use Google Analytics to improve your website’s performance and achieve your goals.
Exploring the Benefits of Google Analytics and GA4
Using Google Analytics has many benefits for website owners and marketers. Here are some of the key benefits:
Track website performance: With Google Analytics, you can track key performance indicators (KPIs) such as traffic, engagement, conversion rates, and revenue. This information can help you optimize your website to improve its performance.
Understand your audience: Google Analytics provides insights into your audience, where they come from, what devices they use, and how they interact with your website. This information can help you create better content, design, and user experience.
Measure marketing campaigns: Google Analytics allows you to track the effectiveness of your marketing campaigns, such as search engine optimization (SEO), pay-per-click (PPC), social media, email, or affiliate marketing. This information can help you allocate your marketing budget more effectively and improve your ROI.
Make data-driven decisions: Google Analytics provides data and insights to help you make informed decisions about your website and marketing strategy. By analyzing the data, you can identify trends, opportunities, and challenges and adjust your tactics accordingly.
Creating a Google Analytics Account
You’ll need to sign up for an account to start using Google Analytics. Follow these steps to create your account:
- Go to the Google Analytics website and click the “Start for free” button.
- Sign in to your Google account, or create one if you already have one.
- Fill out the “New Account” form with your website name, website URL, industry category, and time zone. You can also share your Analytics data with Google to help improve the product.
- Read and accept the terms of the service agreement.
- You will now see your unique tracking code, which you must add to your website.
Congratulations! You have now signed up for Google Analytics and have your tracking code. The following section will show you how to add the tracking code to your website.
If your goal is to generate sales, you’ll want to track the revenue generated by your Google Ads campaign. You’ll need to set up conversion tracking and assign a value to each conversion based on the revenue generated. This will allow you to see how much revenue your campaign generates and how much you spend to generate that revenue.
With sales, you may also want to track other metrics such as conversion rate, average order value, and cost per acquisition. These metrics can help you identify areas where you can optimize your campaign to improve your Google Ads ROI.
Honestly, I consider him part of my Team as well, he really cares about our success. As we grow, he will grow with us. I’m excited about the journey and future with Mike and his Team at Metalogic! If you’re looking at Internet Marketing for your business, simply put he’s the best!

Chris Chustz
Owner, Family First Mortgage
How to Add Google Analytics GA4 to Your Website
Now that you have your Google Analytics tracking code, it’s time to add it to your website. The tracking code is a piece of JavaScript code that you’ll need to add to every page on your website that you want to track. Here are two ways to add the tracking code to your website:
Utilizing Call Tracking for Phone Call Measurement in Google Analytics
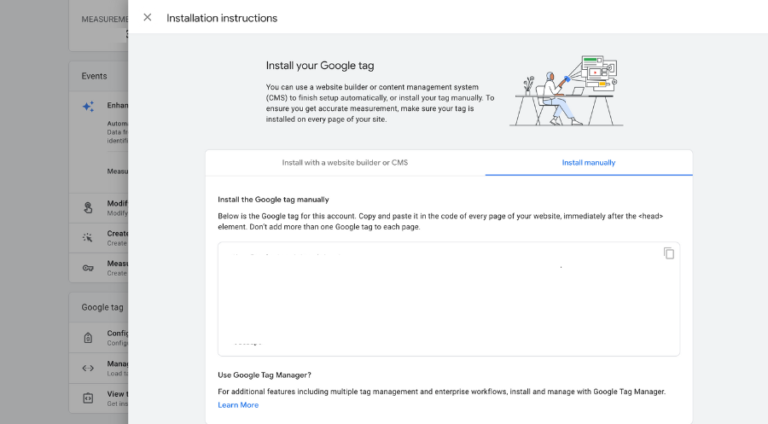
- Copy the tracking code provided by Google Analytics. Admin > Property > Data Streams > Select Data Stream > View Tag Instructions > Install Manually
- Open your website’s HTML file in a text editor.
- Paste the tracking code just before the closing </head> tag.
- Save the changes to your HTML file.
- Upload the updated HTML file to your web server.
Integrating Google Tag Manager with Google Analytics GA4
Google Tag Manager is a free tool that allows you to manage and deploy marketing and analytics tags on your website without modifying the code. Here’s how to use Google Tag Manager to add the Google Analytics tracking code to your website:
- Copy your Google Analytics Measurement ID. Admin > Property > Data Streams > Select Data Stream > Measurement ID
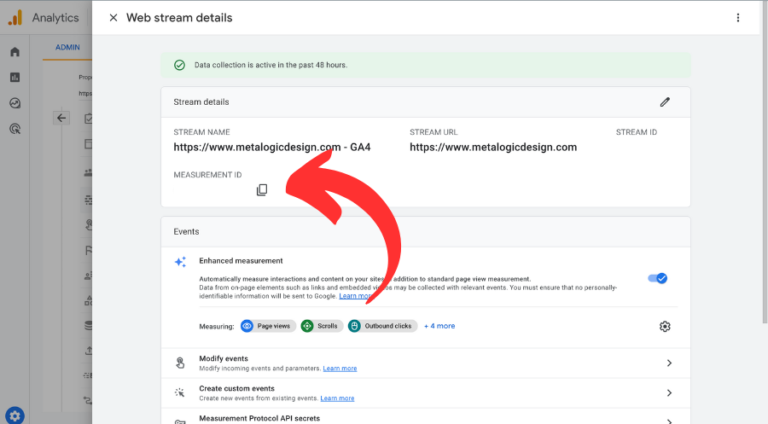
- Sign in to your Google Tag Manager account.
- Click “New Tag” to create a new tag.
- Name the tag “Google Analytics”.
- Select “Google Analytics – Universal Analytics” as the tag type.
- Paste your Google Analytics tracking ID in the “Tracking ID” field
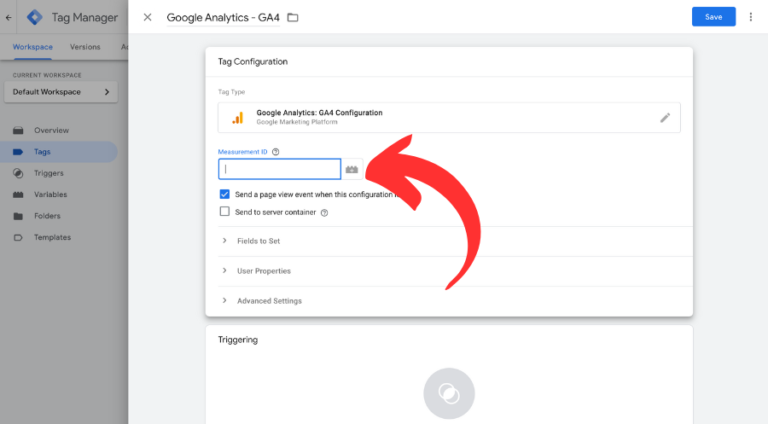
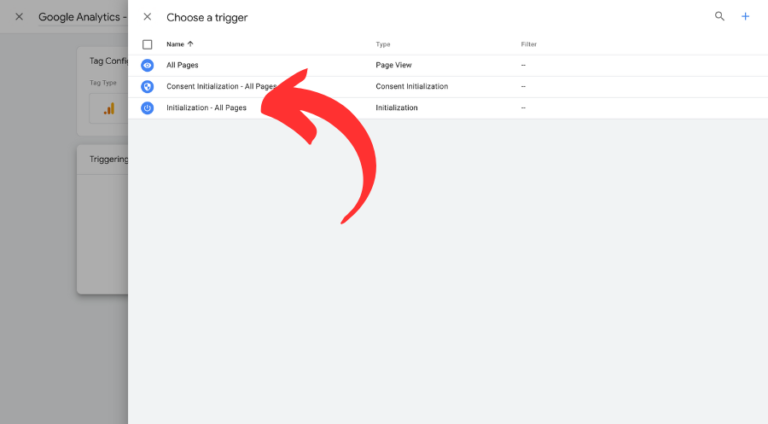
- Under “Triggering”, select “All Pages”.
- Save the tag.
- Publish the changes to your website.
Setting Up Events and Filters in Google Analytics GA4
After adding the tracking code to your website, the next step is to set up events and filters in Google Analytics. Events allow you to track specific actions on your website, such as form submissions or product purchases. Filters help you exclude data from your reports that you don’t want to see, such as internal traffic from your employees.
Setting Up Events in Google Analytics GA4
Here’s how to set up an event in Google Analytics:
- Sign in to your Google Analytics account.
- Go to the “Admin” section and select the property you want to create the event in.
- Click “Events.”
- Click “Create event” > “Create” to configure a new event.
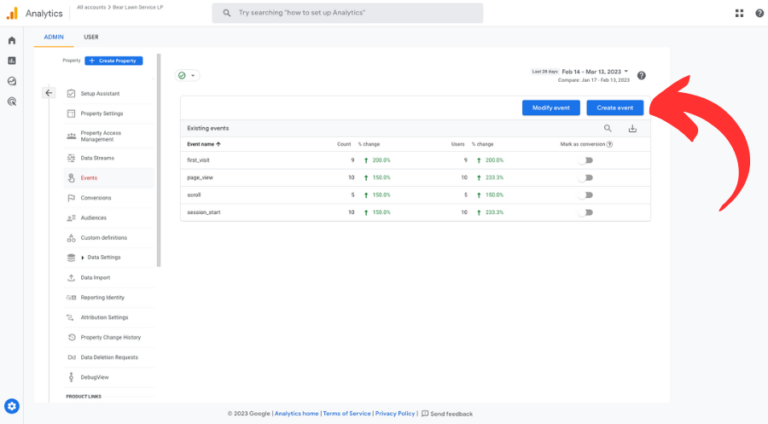
- Configure the event’s details, such as the event name, type, and value.
- Save the event
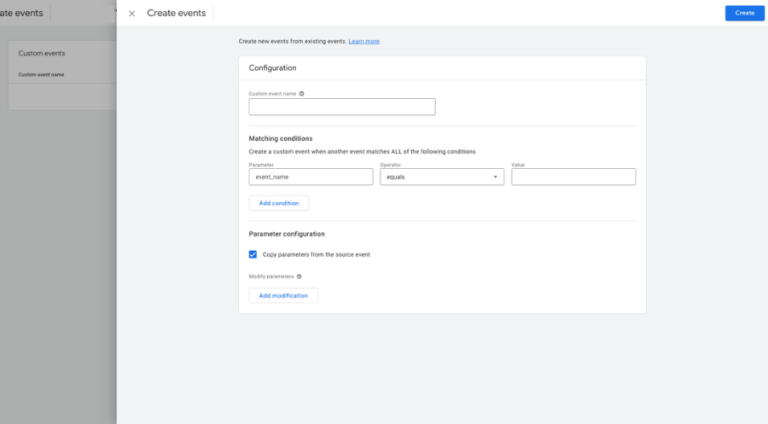
You have set up an event in Google Analytics. You can now track conversions, and more importantly, keep tabs on your Google Ads conversion tracking to see how your website and ads are performing.
Setting Up Events
Here’s how to set up a filter in Google Analytics:
- Sign in to your Google Analytics account.
- Go to the “Admin” section and select the account and property you want to set up the filter.
- Click “Data Filters” under “Data Settings.”
- Click “Create filter” to create a new filter.
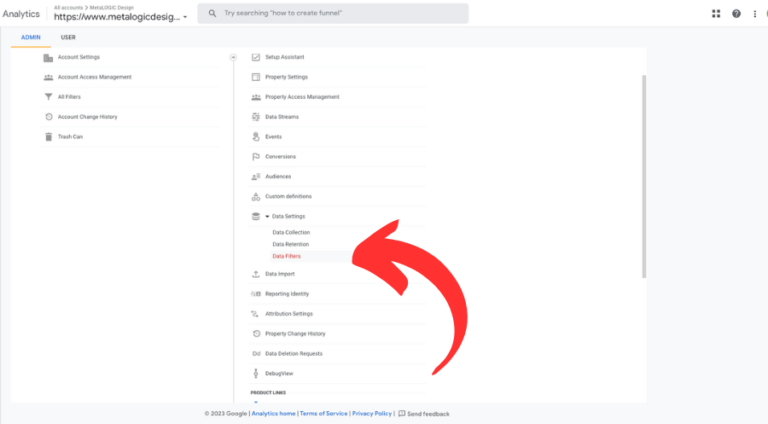
- Choose a filter type, such as “Developer traffic” or “Internal traffic.”
- Configure the details of the filter, such as the filter name and the filter pattern.
- Save the filter.
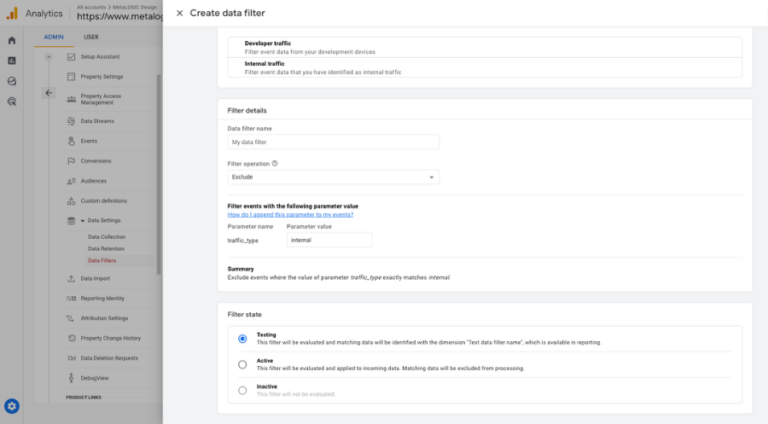
You have successfully set up a filter in Google Analytics. You can now exclude traffic from specific IP addresses, subdomains, or directories.
The following section will show you how to view and interpret your Google Analytics data.
Interpreting and Analyzing Data in Google Analytics GA4
- Sign in to your Google Analytics account.
- Go to the “Reports” section.
- Select the view you want to analyze from the “View” dropdown menu.
- Use the left-hand menu to navigate to different reports, such as “Realtime,” “Acquisition,” “Engagement,” “Monetization,” “Retention,” “Demographics,” and “Tech.” (More on this in a second)
- Use the date range selector in the upper right corner to choose the time period you want to analyze.
- Analyze the data in the report, and look for trends and insights.
- Use the secondary dimensions and segments to refine the data and get deeper insights.
- Export the data to a spreadsheet or other tools for further analysis or reporting.
Understanding Different Report Types in Google Analytics GA4
Once you have set up Google Analytics on your website and started collecting data, you’ll want to start analyzing the reports to gain insights into your website’s performance and your audience’s behavior. Google Analytics offers a variety of report types, each providing unique information and metrics that can help you better understand your website’s performance. In this section, we’ll explore the different report types available in Google Analytics and how you can use them to gain valuable insights.
Real-Time Report
Realtime refers to the ability to see live data and activity on your website or app as it happens. The Realtime reports provide information on your users’ current activity, such as the number of active users, the pages they are viewing, and the events they are triggering.
The Realtime reports in GA4 include the following:
- Overview: This report shows the number of active users on your site or app, the top active pages, and the top active events.
- Locations: This report shows the geographic location of your active users and how they interact with your site or app in real-time.
- Traffic Sources: This report shows the sources of traffic to your site or app, such as direct traffic, search traffic, or referral traffic, and how they contribute to your real-time activity.
- Events: This report shows the events triggered on your site or app in real time and how users interact with your content and features.
By analyzing the Realtime reports, you can gain immediate insights into your users’ current activity and how they interact with your content and features in real-time. This can help you identify any issues or opportunities and make real-time optimizations to improve the user experience and drive more conversions and revenue for your business.
Acquisition
Acquisition refers to the process of acquiring or gaining new users to your website or app and the channels or sources that bring them to your site or app. The Acquisition reports provide information on how users find and come to your website or app and how they behave once they get there.
The Acquisition reports in GA4 include the following:
- Traffic Acquisition: This report shows the number of users who come to your site from different traffic sources, such as organic search, social media, paid search, email, etc.
- User Acquisition: This report shows the number of new users who visit your site or app, broken down by date, source, and medium.
- Engagement Acquisition: This report shows the engagement metrics for the users acquired through different channels, such as bounce rate, pages per session, and session duration.
- Stream Acquisition: This report shows the sources and content of the user interactions with your site or app’s stream, such as views, clicks, and shares.
By analyzing the Acquisition reports, you can gain insights into which channels are driving the most traffic and engagement to your site or app, and optimize your marketing efforts to improve the acquisition and retention of users.
Engagement
Engagement refers to the level of interaction and activity of your users on your website or app. The Engagement reports provide information on how users are engaging with your content and how they are interacting with your site or app.
The Engagement reports in GA4 include the following:
- Engagement: This report shows the total number of engagements, such as clicks, pageviews, and scroll depth, and the average engagement rate per session and per user.
- Engagement Rate: This report shows the percentage of sessions that resulted in an engagement, such as clicks, page views, or events.
- Engagement Time: This report shows users’ average time engaging with your content.
- Engagement Event: This report shows the number of times specific events was triggered, such as video plays, file downloads, or form submissions.
With Engagement reports, you can gain insights into how users interact with your content and how engaged they are with your site or app. This can help you optimize your content and user experience to improve the engagement and retention of users.
Monetization
Monetization refers to the process of generating revenue from your website or app, and the revenue streams and sources that contribute to your overall revenue. The Monetization reports providing information on how users are generating revenue for your business and how you can optimize your revenue streams.
The Monetization reports in GA4 include the following:
- E-commerce: This report shows the revenue and transactions generated by your e-commerce store, including product sales, refunds, and shipping costs.
- Ads: This report shows the revenue and performance of your ad campaigns, including ad impressions, clicks, and cost per click.
- Sales: This report shows the revenue and transactions generated by your offline sales channels, such as phone orders or in-store purchases.
- Subscriptions: This report shows the revenue and performance of your subscription-based services, including subscription sign-ups, cancellations, and revenue.
With Monetization reports, you can gain insights into which revenue streams and sources are most profitable and how you can optimize your monetization strategies. This can help you increase revenue, reduce costs, and improve the overall profitability of your business.
Retention
Retention refers to the ability of your website or app to retain and keep users engaged over a certain period of time. The Retention reports provide information on how many users return to your site or app, how often they return, and how they engage with your content over time.
The Retention reports in GA4 include the following:
- Cohort Analysis: This report shows the retention rate of users who first visited your site or app during a specific time period and how they engage with your content over time.
- User Retention: This report shows the number of users who return to your site or app after their initial visit, broken down by date, source, and medium.
- Behavior Retention: This report shows the behavior of users who return to your site or app over time, including the number of sessions, the duration of sessions, and the actions they take during those sessions.
With Retention reports, you can gain insights into how well your site or app retains users, which user groups are more likely to return and engage with your content, and how you can improve the user experience to increase retention and loyalty. This can help you optimize your marketing efforts, improve user engagement, and ultimately drive more conversions and revenue for your business.
Demographics
Demographics refers to the characteristics of your users, such as age, gender, and interests. The Demographics reports provide information on your users’ demographic profile and how they interact with your content and engage with your site or app.
The Demographics reports in GA4 include the following:
- Age and Gender: This report shows the age and gender distribution of your users and how they engage with your content and interact with your site or app.
- Interests: This report shows your users’ interests, based on their browsing behavior and engagement with your content, and how you can tailor your content to meet their interests better.
- Geolocation: This report shows the geographic location of your users and how they engage with your content and interact with your site or app from different regions.
With Demographics reports, you can gain insights into the characteristics of your users and how they interact with your content and engage with your site or app. This can help you optimize your content, and user experience better to meet the needs and preferences of your target audience and ultimately drive more conversions and revenue for your business.
Tech
Tech refers to the technology used by your users to access your websites or app, such as the type of device, operating system, and browser. The Tech reports providing information on the technology profile of your users and how they interact with your content and engage with your site or app.
The Tech reports in GA4 include the following:
- Devices: This report shows the type of devices used by your users, such as desktop, mobile, or tablet, and how they interact with your content and engage with your site or app.
- Operating Systems: This report shows the operating systems used by your users, such as Windows, iOS, or Android, and how they interact with your content and engage with your site or app.
- Browsers: This report shows the browsers used by your users, such as Chrome, Safari, or Firefox, and how they interact with your content and engage with your site or app.
By analyzing the Tech reports, you can gain insights into the technology profile of your users and how they interact with your content and engage with your site or app. This can help you optimize your user experience better to meet the needs and preferences of your target audience and ensure that your website or app is accessible and usable across different devices and platforms.
In addition to these main reports, Google Analytics offers many sub-reports and customization options that allow you to drill down into specific aspects of your website’s performance. You can also create custom reports, dashboards, and alerts that suit your needs and preferences. The key is to regularly monitor and analyze your data and use it to make informed decisions that improve your website’s performance and ROI.
Custom Marketing Plans Starting at $500 / month
Tips and Best Practices for Using Google Analytics GA4
Set up events and filters: As we mentioned, setting up events and filters can help you track specific actions and exclude unwanted traffic from your reports. Set up events and filters that align with your business objectives.
Focus on the metrics that matter: Don’t get overwhelmed by the sheer volume of data in Google Analytics. Focus on the most relevant metrics to your events and track them over time.
Use segments and secondary dimensions: To get deeper insights into your data, use segments and secondary dimensions to slice and dice your data. This can help you identify patterns, trends, and opportunities that may not be visible in the overall data.
Regularly review and optimize: Don’t set up Google Analytics and forget about it. Periodically review your data and optimize your website and marketing tactics based on your findings. This can help you stay ahead of the competition and improve your ROI.
By following these tips, you can get the most out of Google Analytics and use it to improve your website’s performance and marketing ROI.
Conclusion
In conclusion, setting up and using Google Analytics on your website is essential for understanding your audience, tracking your website’s performance, and measuring the effectiveness of your marketing campaigns. By following the steps outlined in this article, you can get started with Google Analytics and gain valuable insights into your website’s traffic, engagement, and conversions.
Remember, Google Analytics is a powerful tool that can provide a wealth of data and insights. It’s essential to regularly review and optimize your data to ensure that you’re getting the most out of the tool. By focusing on the metrics that matter, using segments and secondary dimensions, and regularly reviewing and optimizing your data, you can gain a competitive advantage and improve your website’s performance and marketing ROI.
Lastly, remember that Google Analytics is a constantly evolving tool and staying up-to-date with the latest updates and best practices is essential. By staying informed and adapting to changes in the platform, you can continue to use Google Analytics to improve your website and business.
Become A Google Ads Specialist With MetaLOGIC's Local Digital Marketing Academy
Get your business in front of the right people with Google Ads. From display and search campaigns to Shopping and video campaigns, there’s a way to reach your target audience on the Google Ads platform. Don’t wait to see results – Learn more about our Google Ads Online Training Course.


